
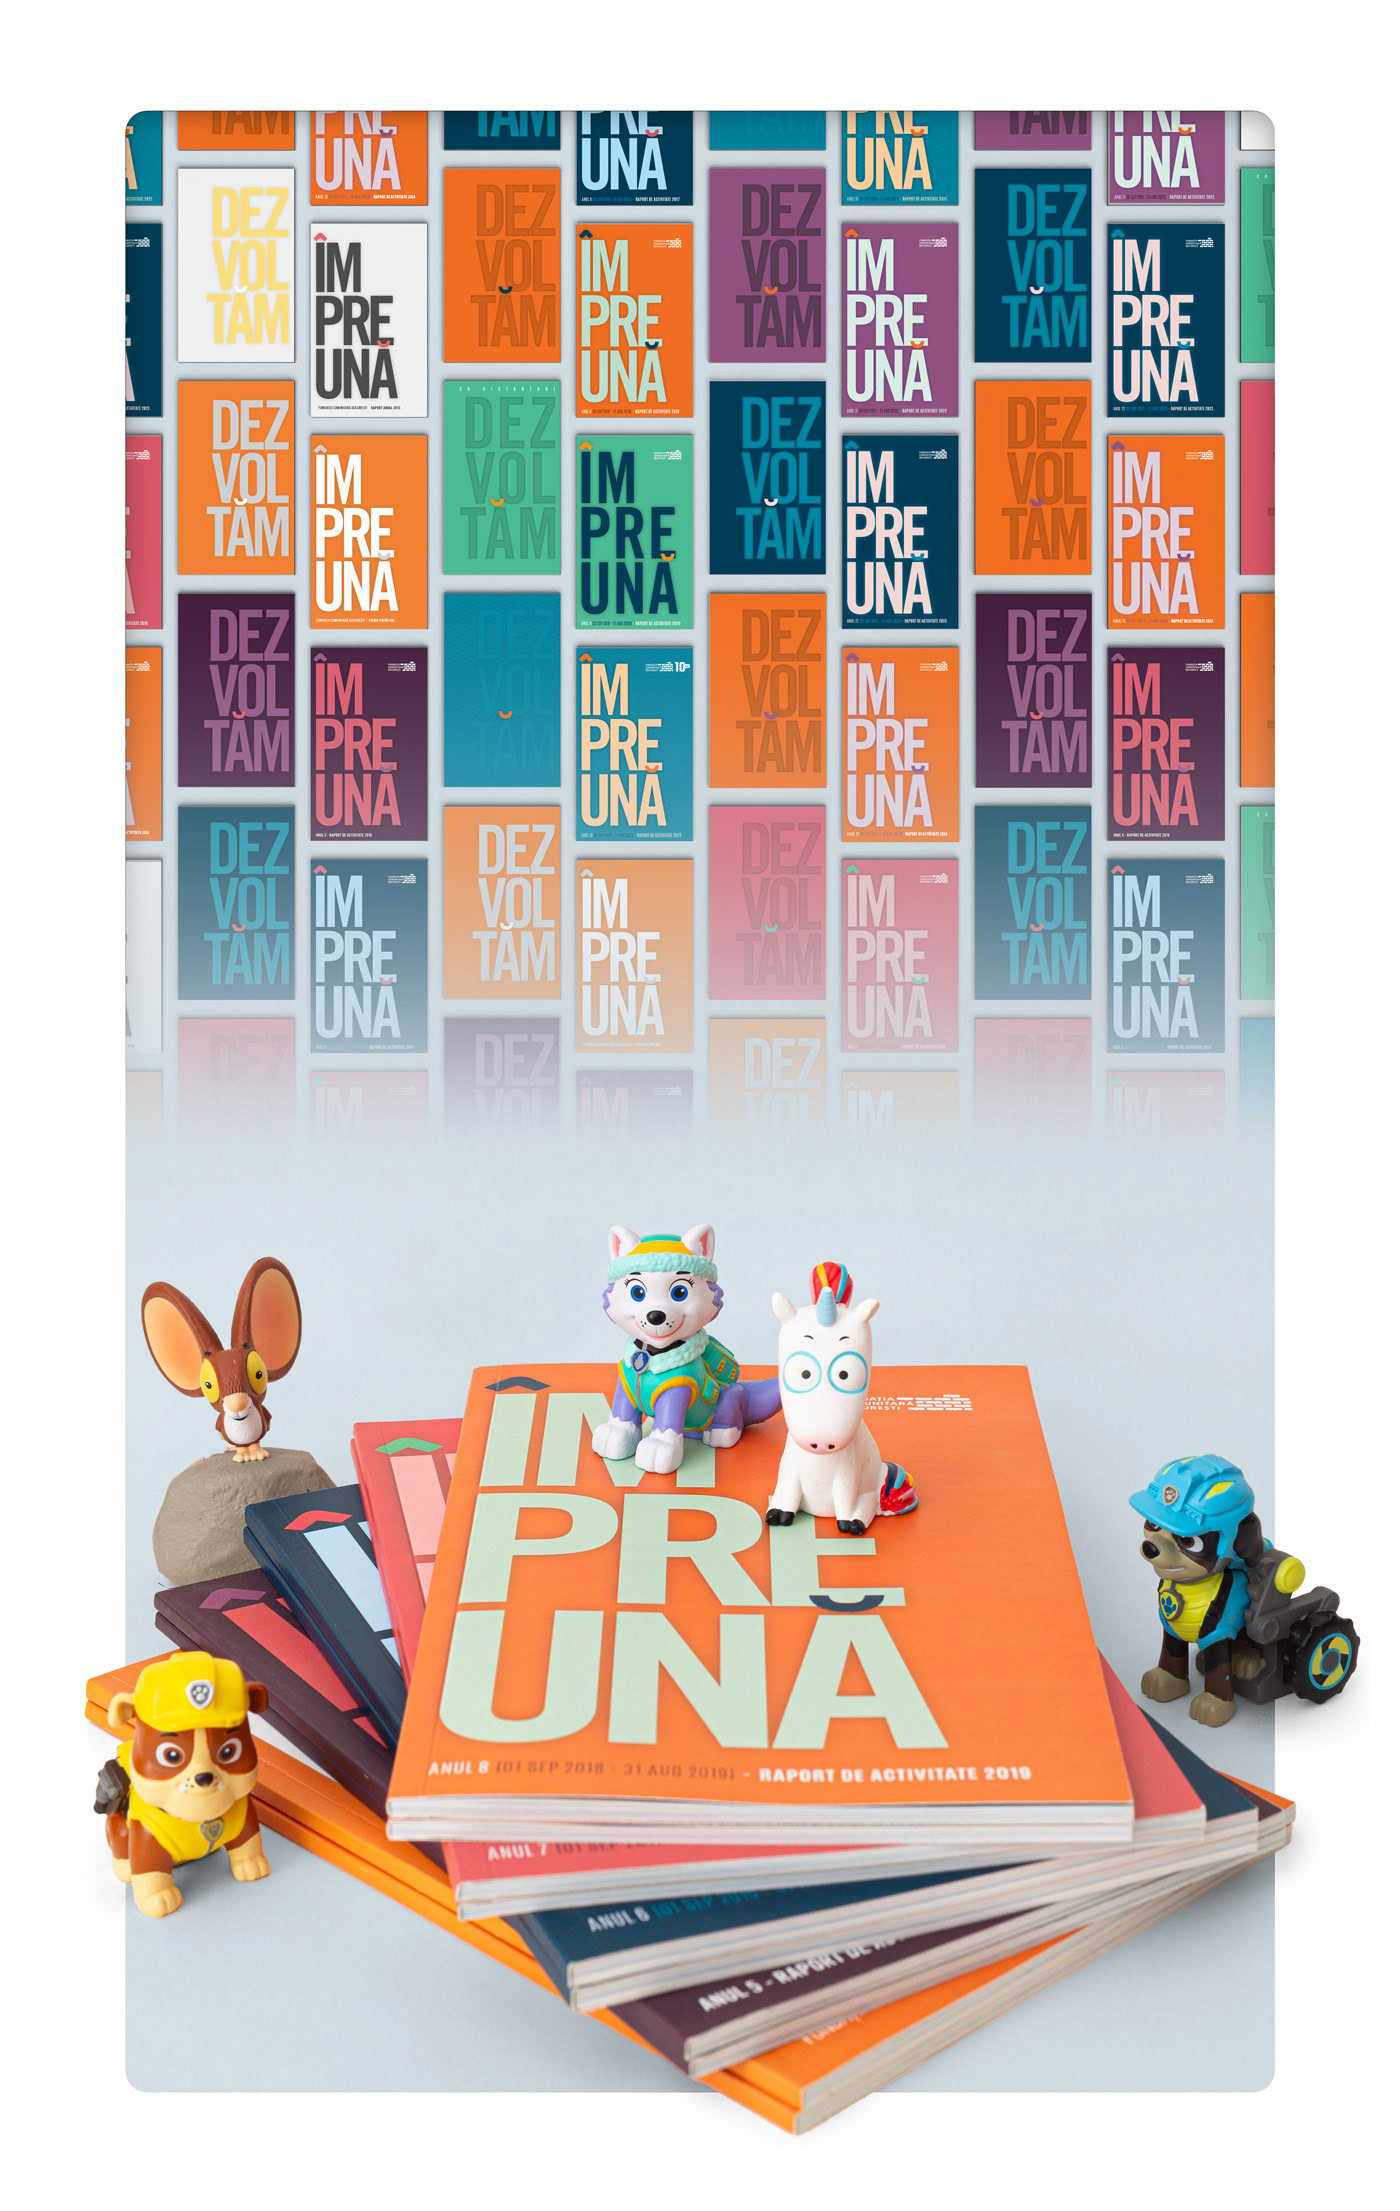
Bucharest needs a community foundation. A record of how much so is detailed in a collection of activity reports, going back to 2013.
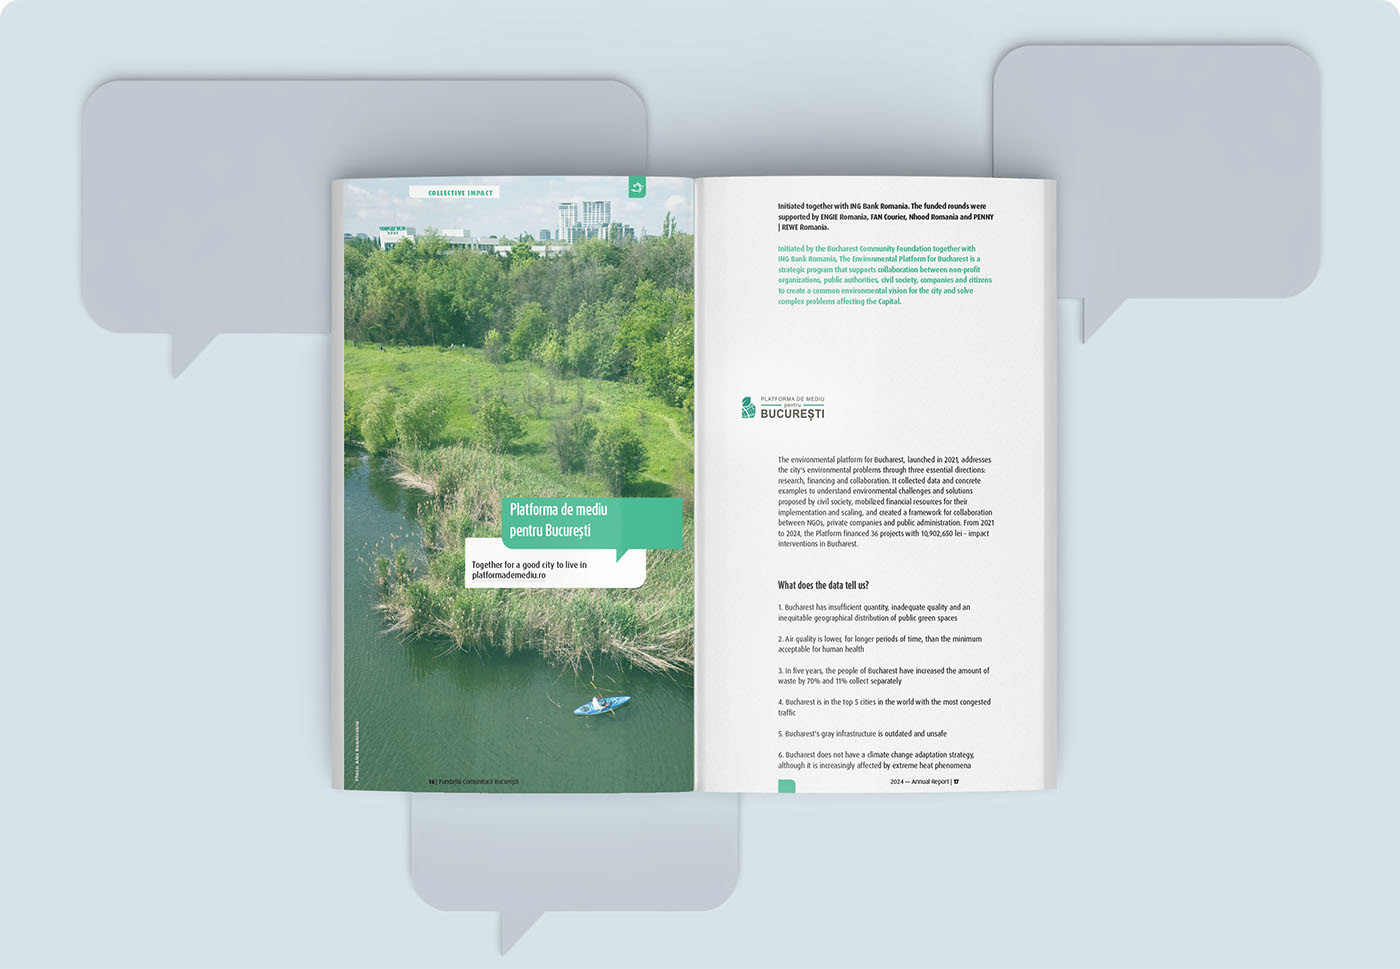
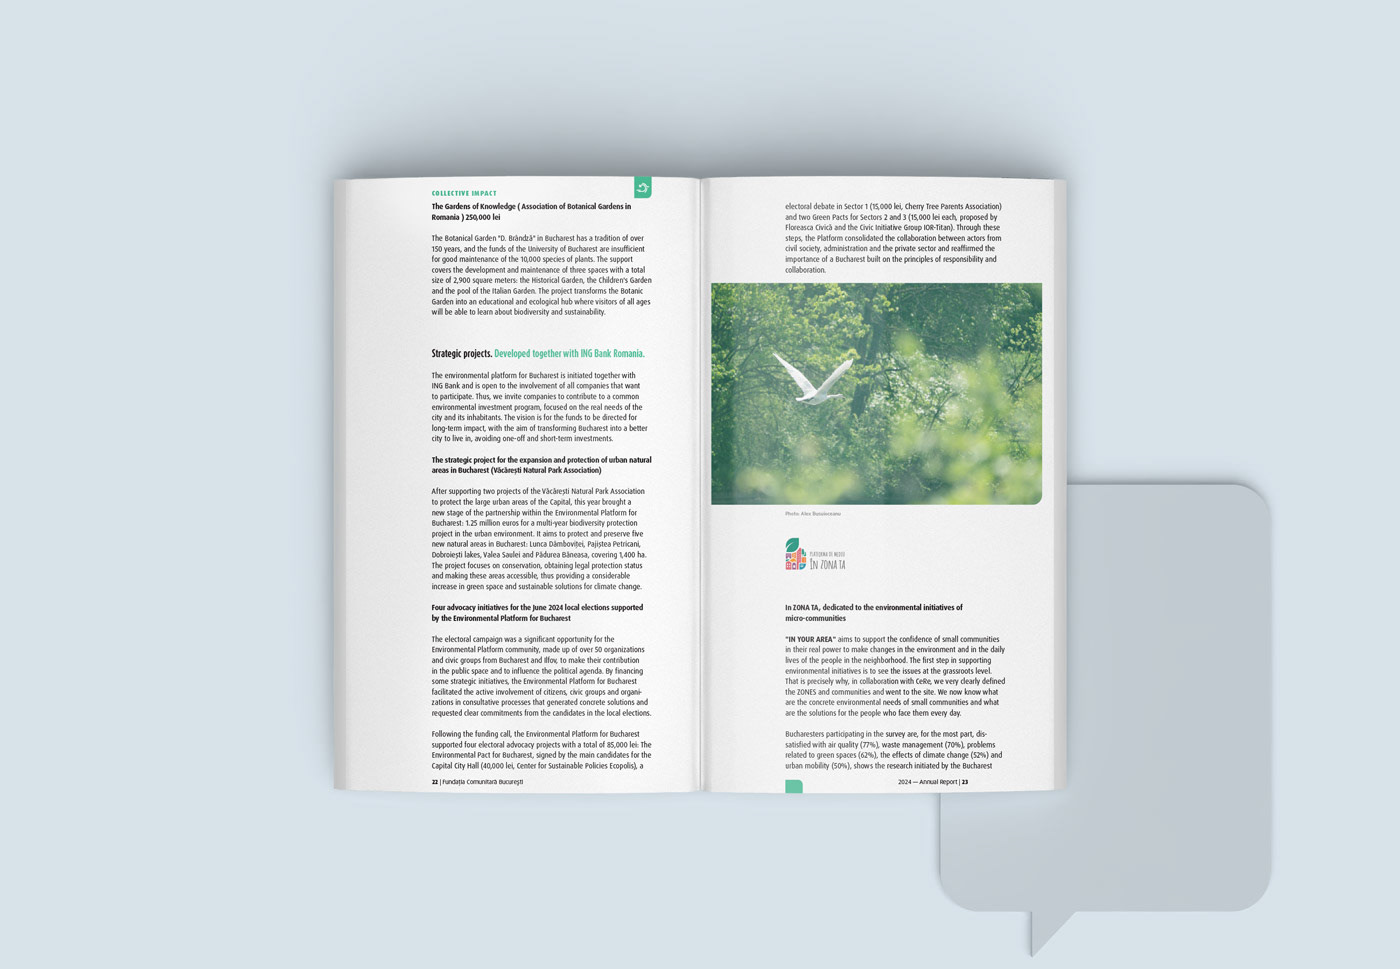
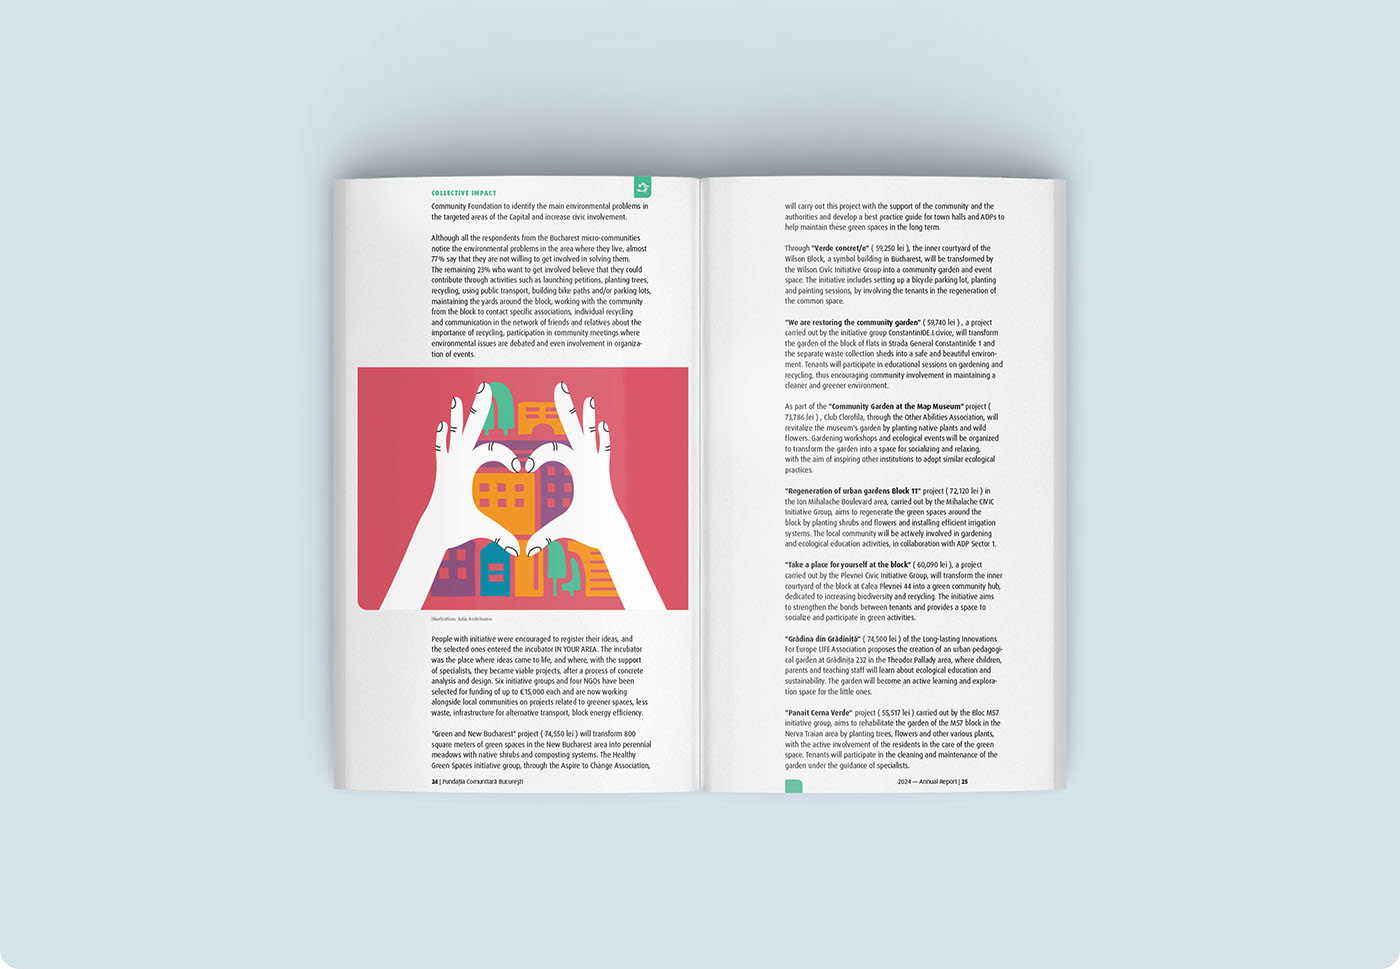
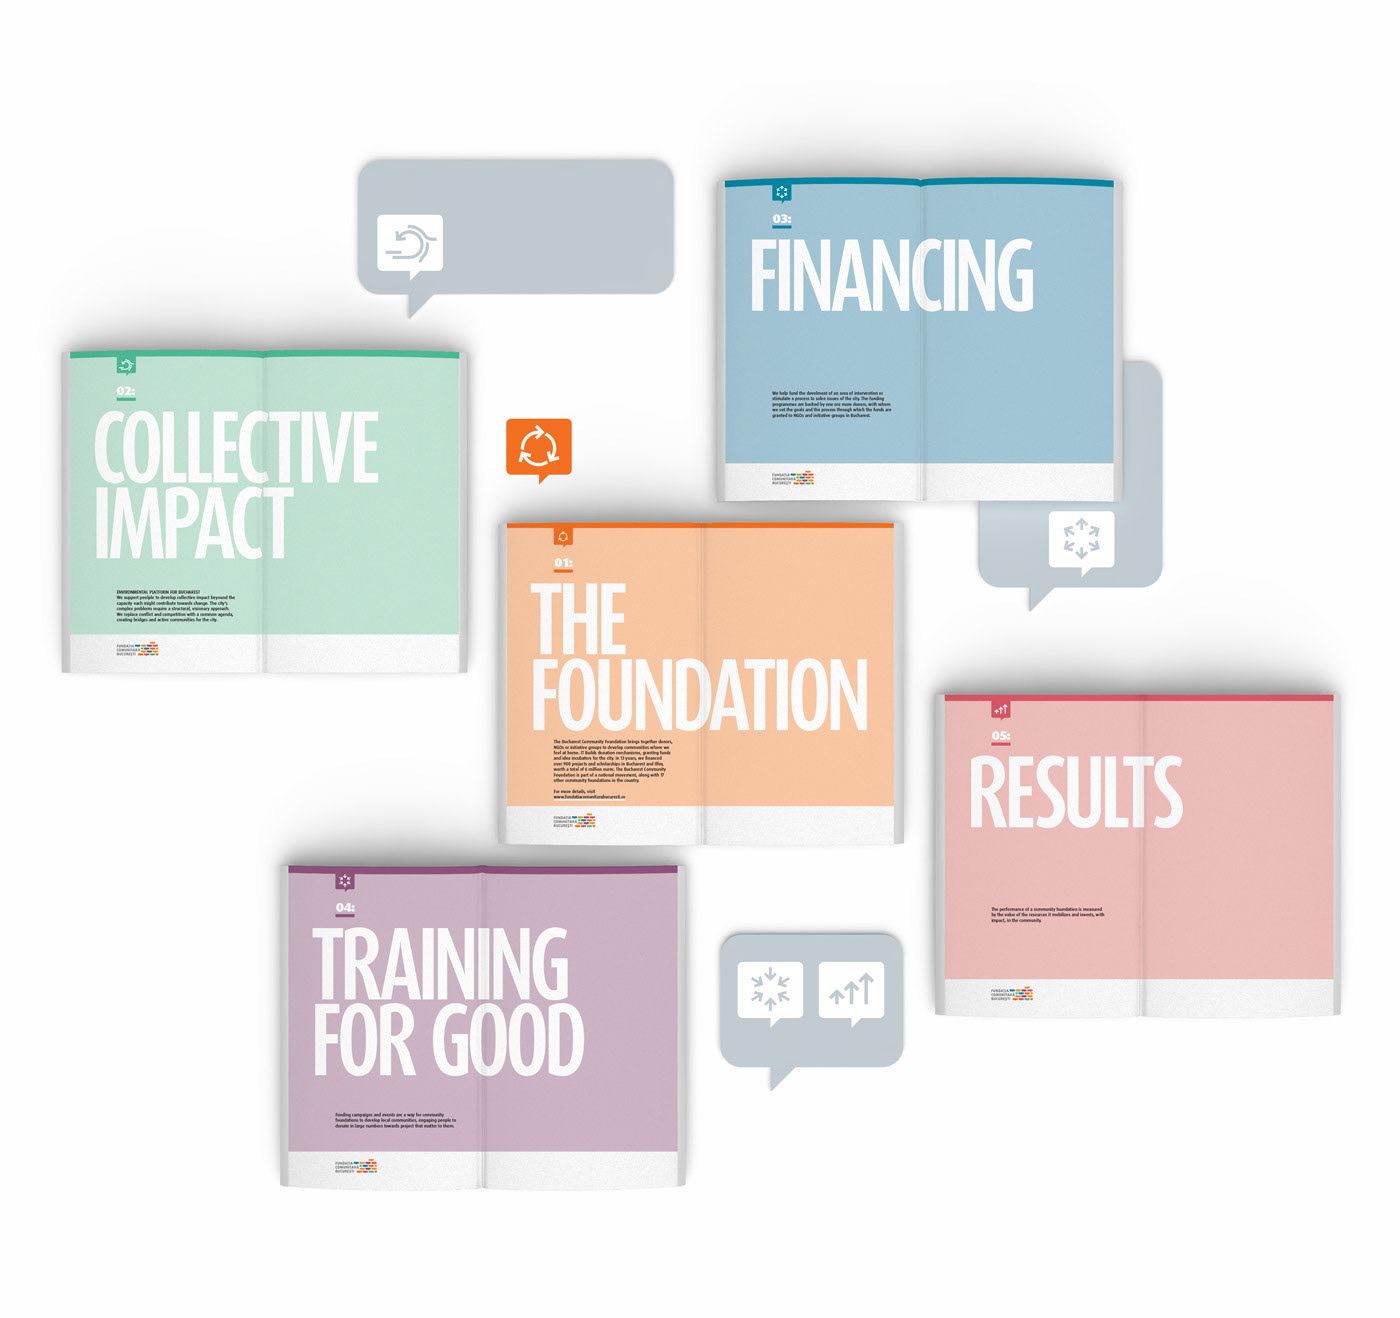
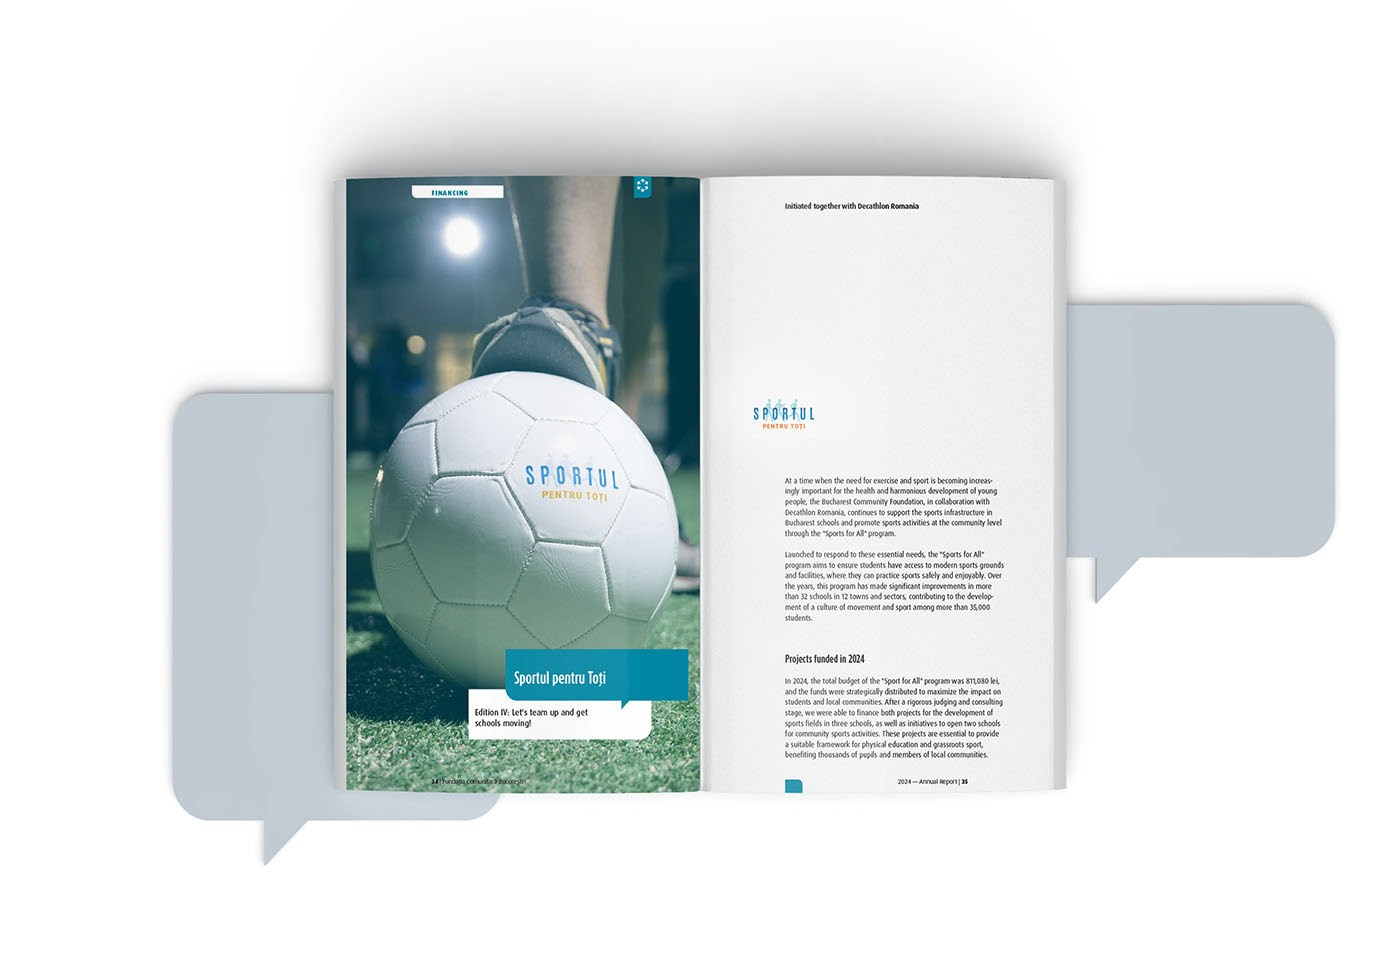
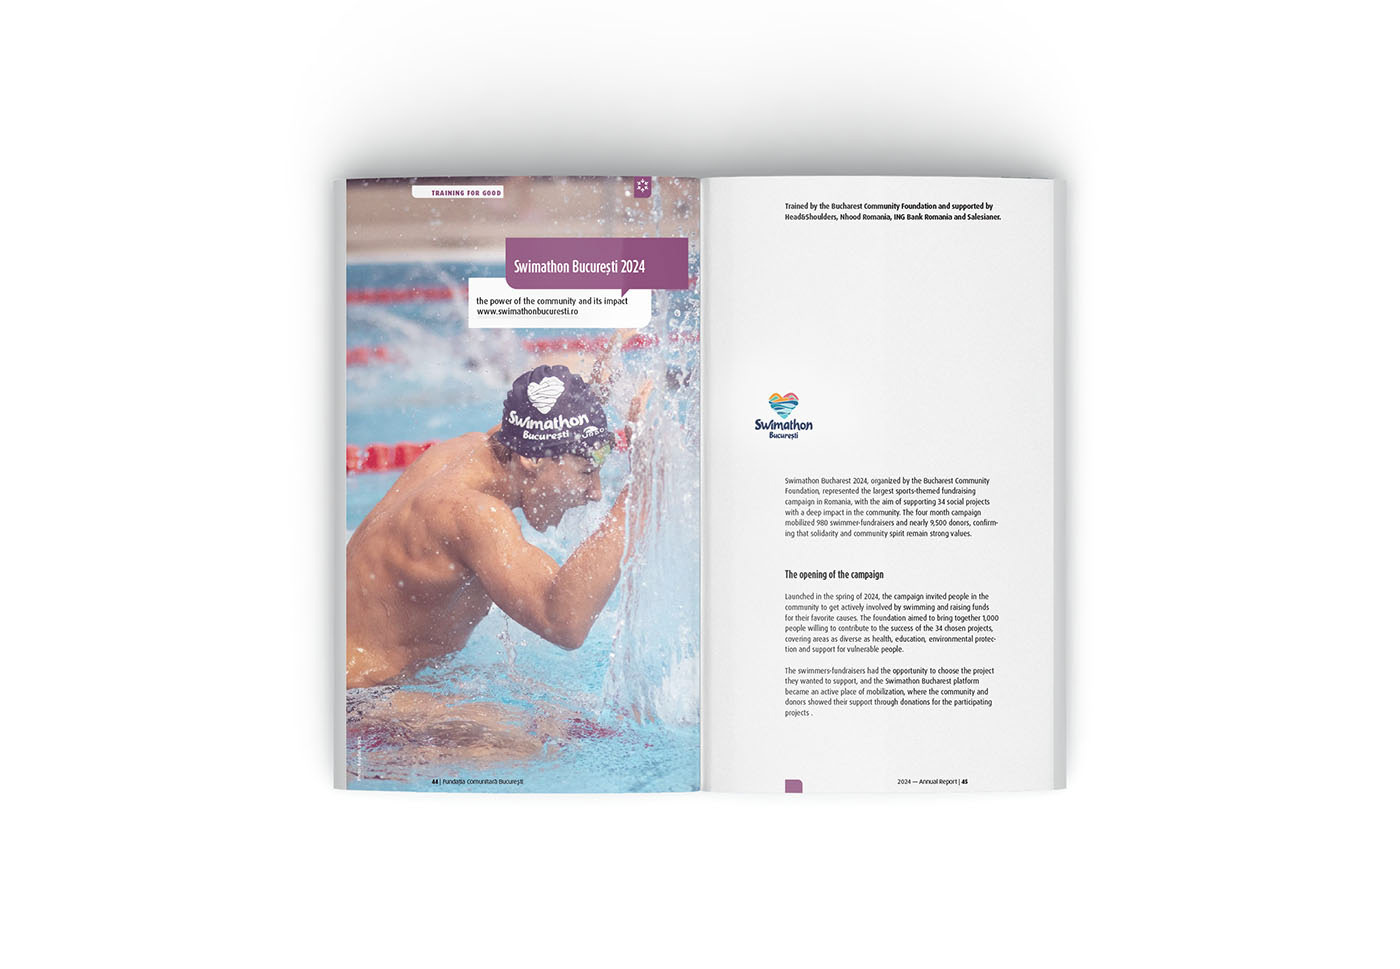
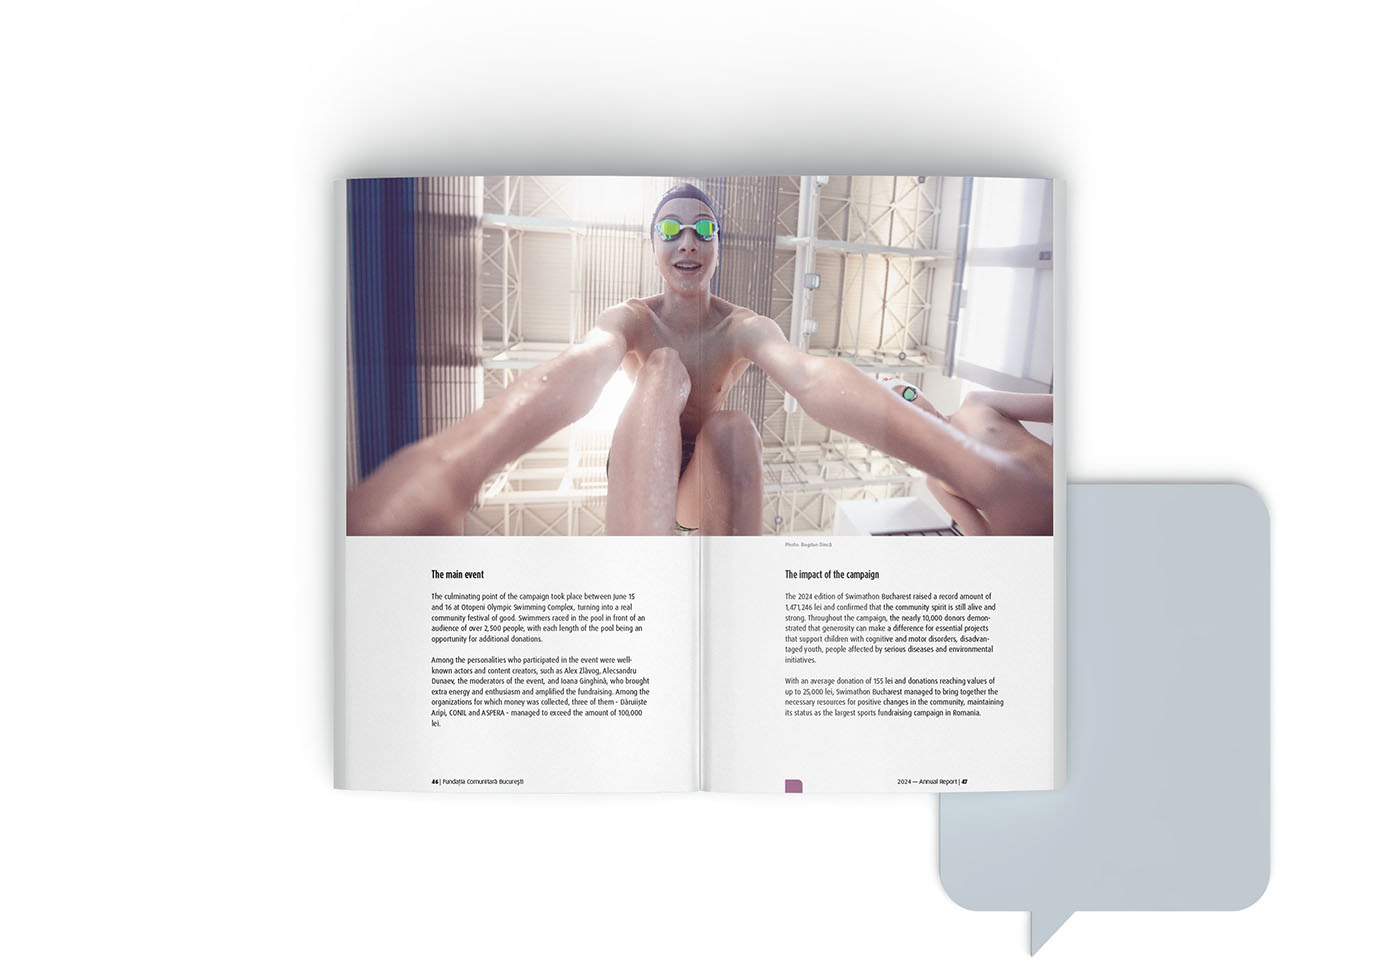
The format is atypical, the layout features bold chapter covers, careful alignments, relevant photography, brand-aligned typography, color and icon customizations.
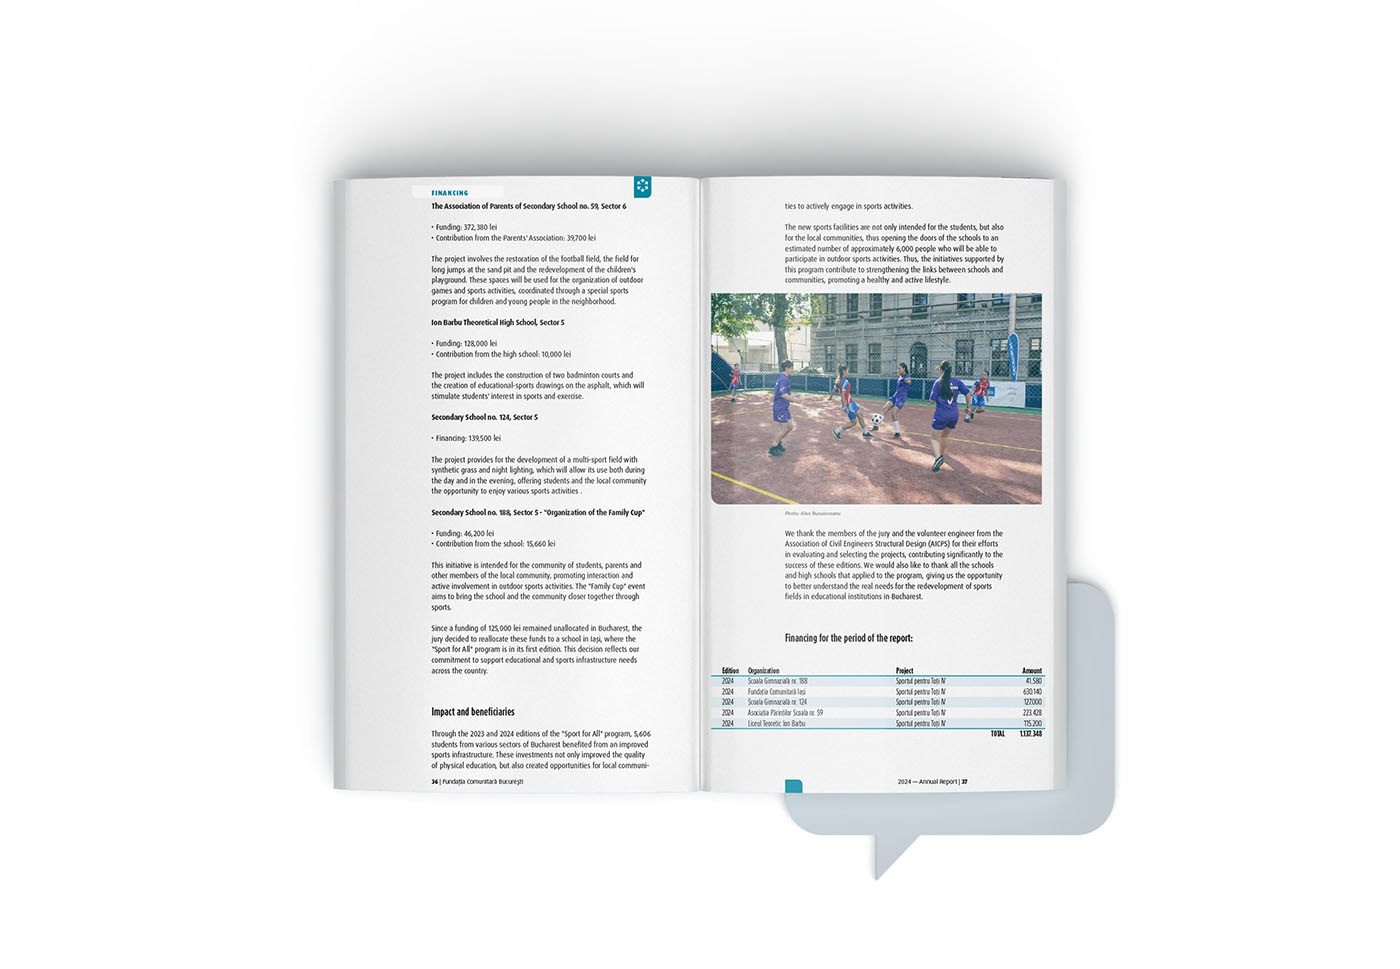
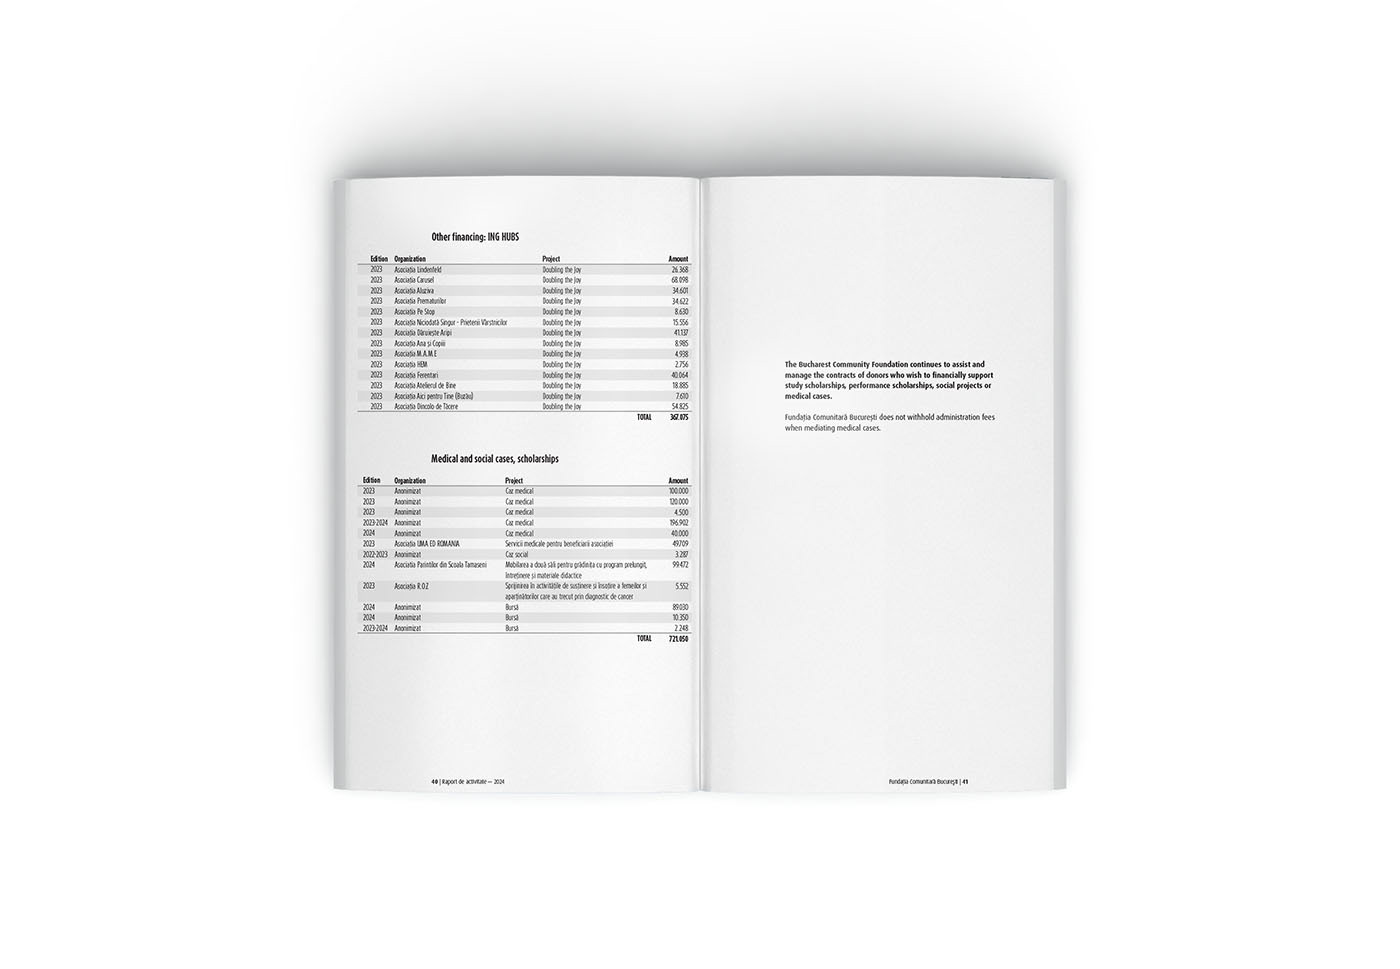
Tabular data has a significant weight in an annual report and it needs to be clearly and consistently laid out for easy reading and reference.
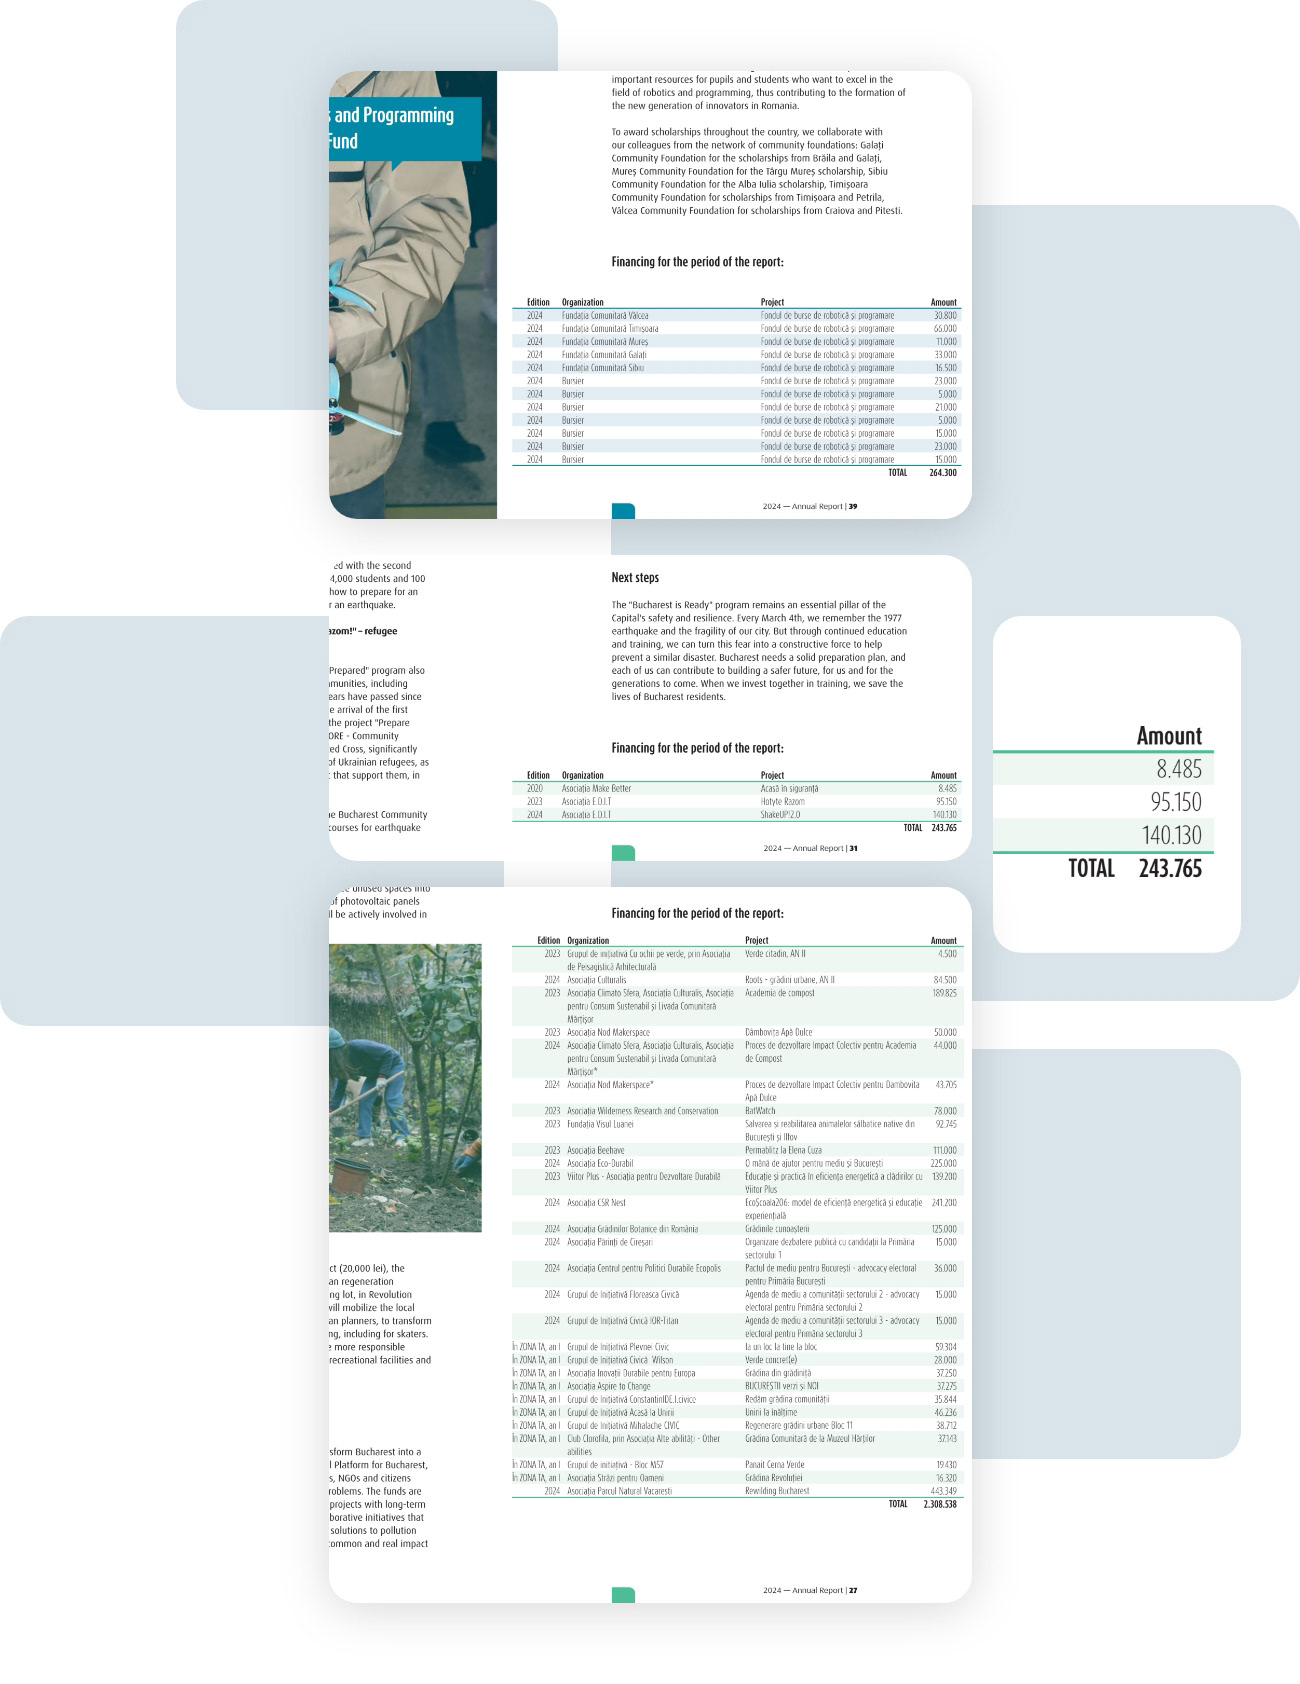
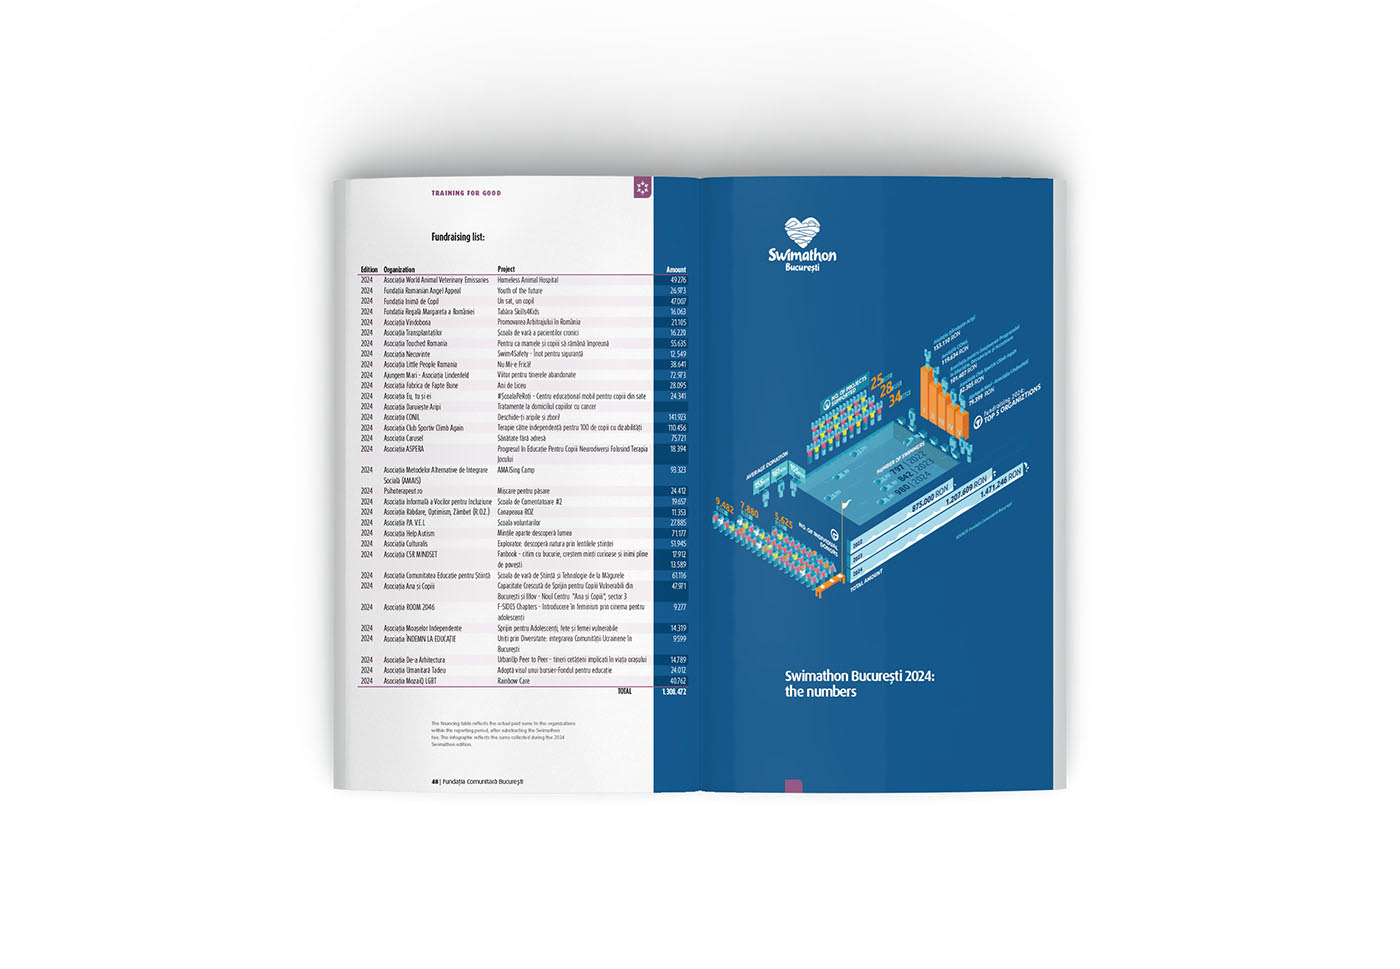
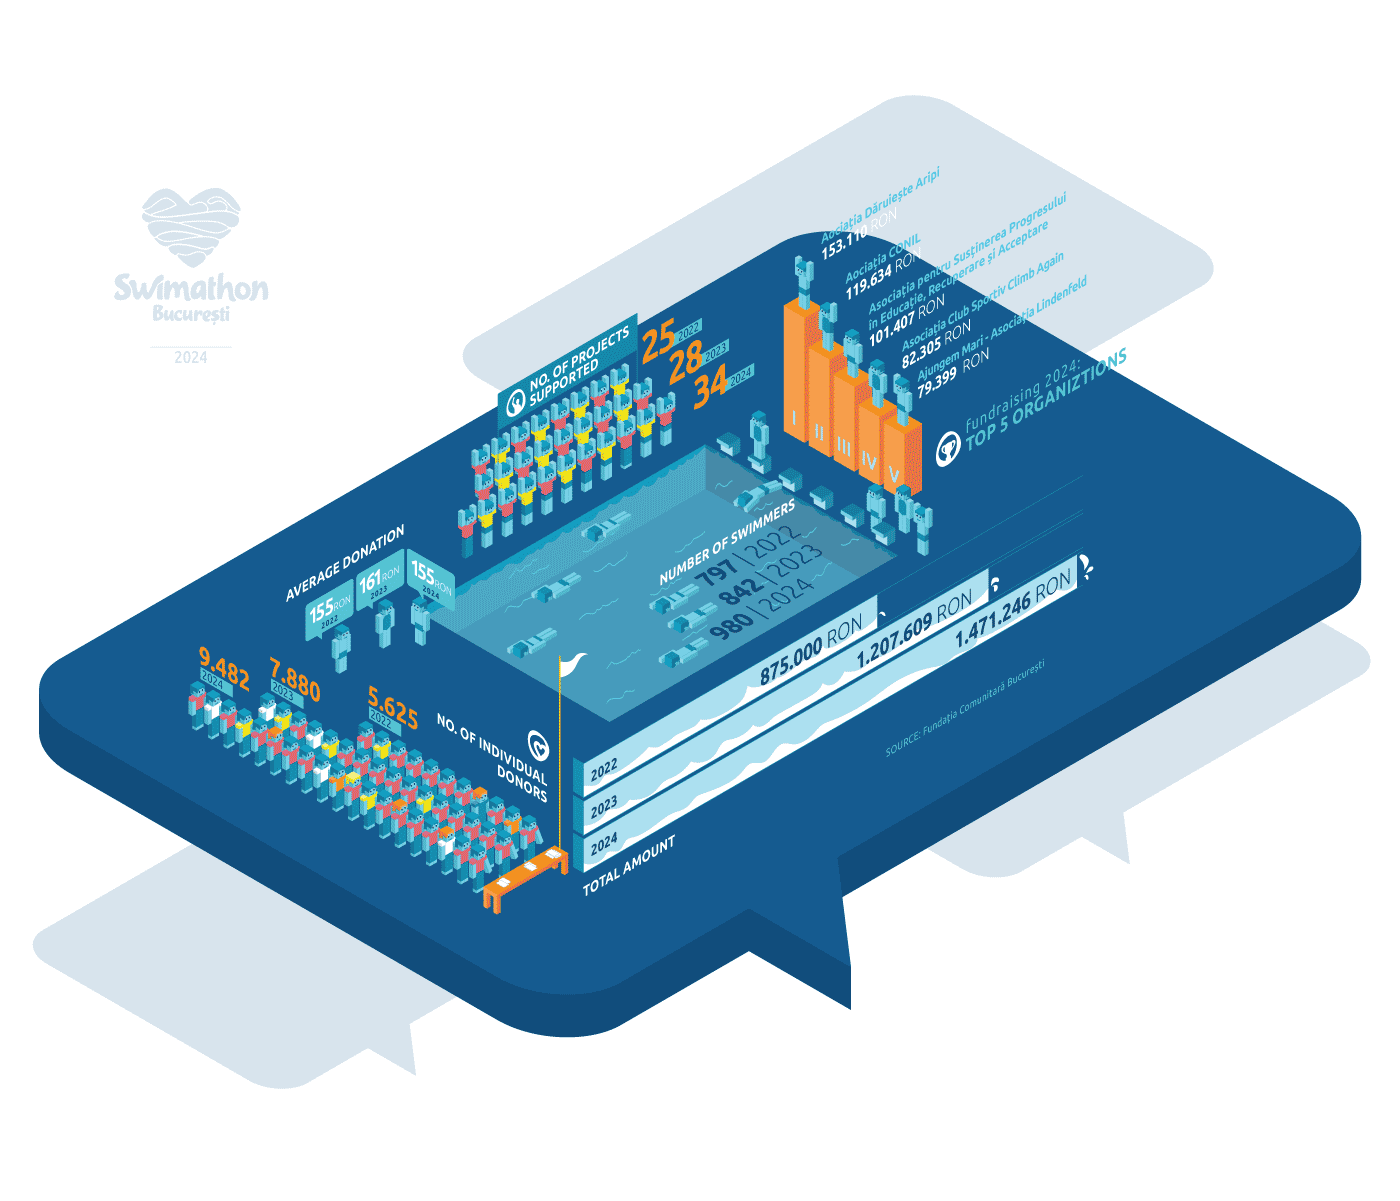
Placing data in a visual context is an effective tool to facilitate understanding. Infographics are making complex situations easier to compare and contrast.
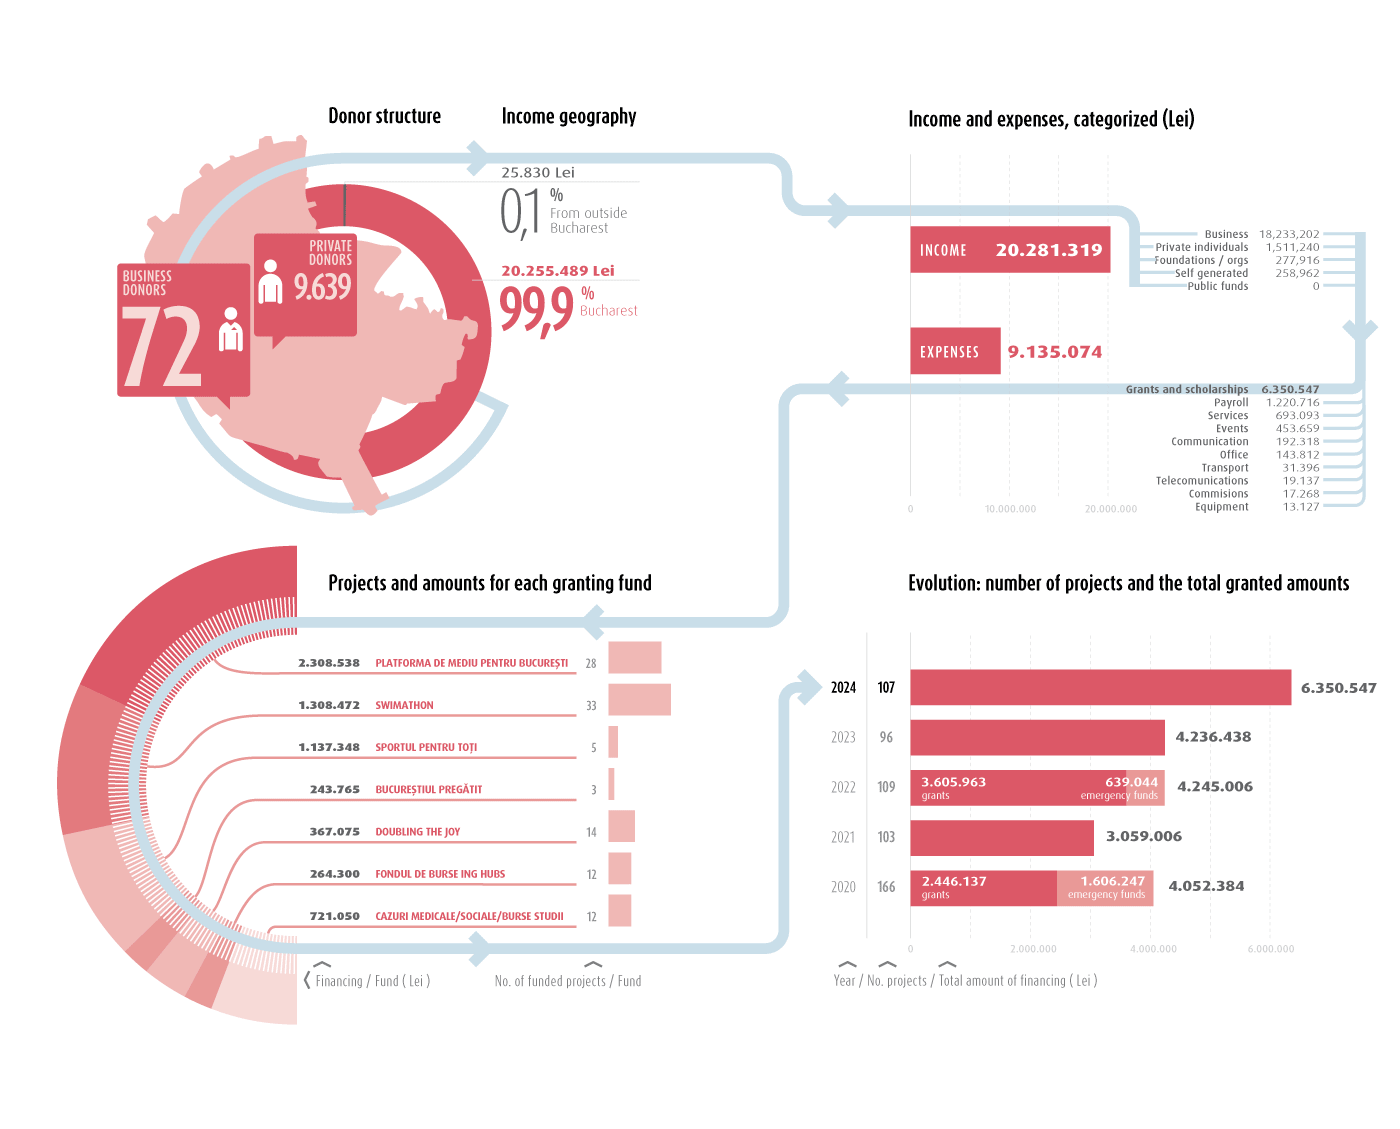
Follow the money: start with how the funds are raised, then run through different breakdowns of how they are spent and distributed. Find below the evolution of this infographic over the years.
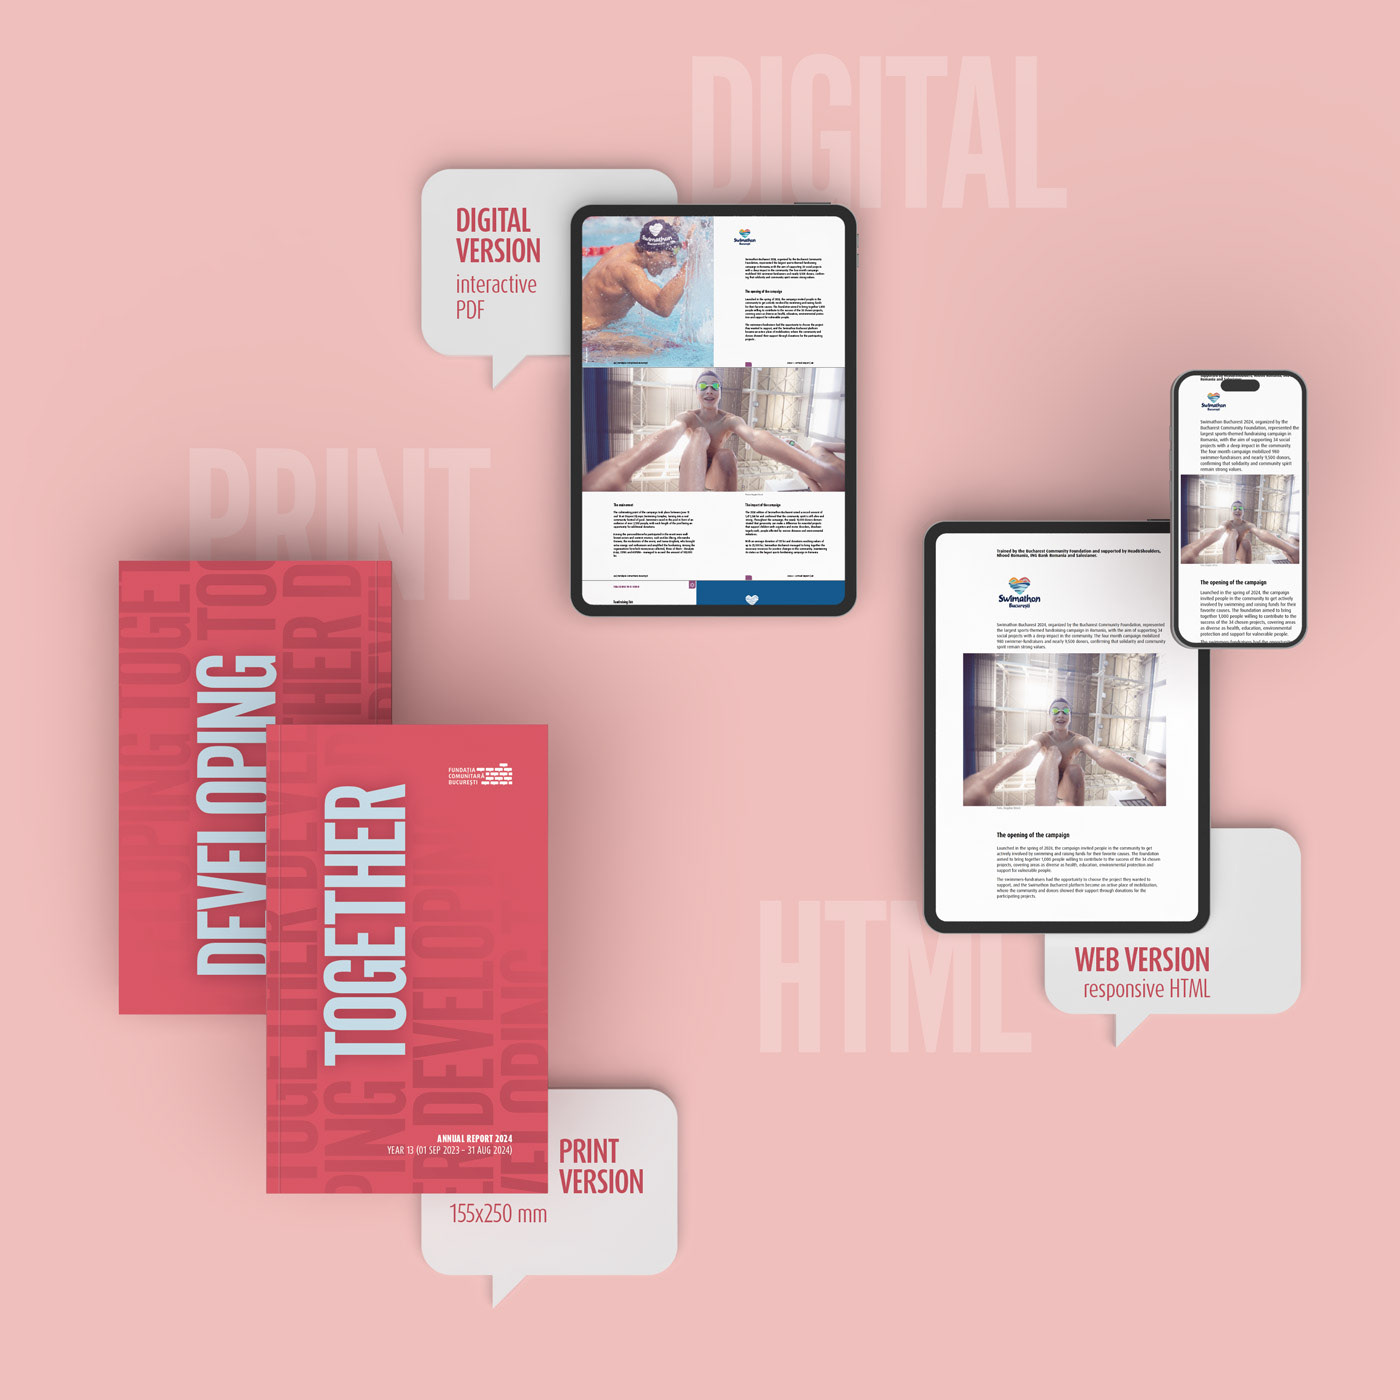
For the 2024 edition we designed several versions: classic print, compact PDF (RO and EN), and responsive HTML.
The HTML version aims to adapt the look and feel of the print report, and to fit all content in one scroll-friendly page. The code is clean, lean and optimized, while keeping an eye on accessibility features.

Not all editions had a print run over the years. The ones that did have a permanent place in my collection.
Read all quotes in full, complete with author names and positions on my LinkedIn profile.